During custody hearings, it’s normal to wonder about the outcome and your children’s future. Are you or your spouse more likely to be granted custody of the children, and how are custody decisions made? Does gender play a role, and if so, how much of one?
These child custody statistics break down data related to custody by gender, which parent is more often granted custody, fathers’ rights, and more.
Child custody is a term that encompasses the legal right to care for and make major decisions concerning a child. The custodial parent gets to decide issues such as schooling, child care, medical care, religious activities, travel, and extracurricular activities such as sports or summer camp.
Child custody can affect biological or adopted children. One parent may be granted sole custody (or full custody), or both parents may have custody under a joint custody agreement. Courts attempt to determine child custody based on what is in the “best interests of the child.”
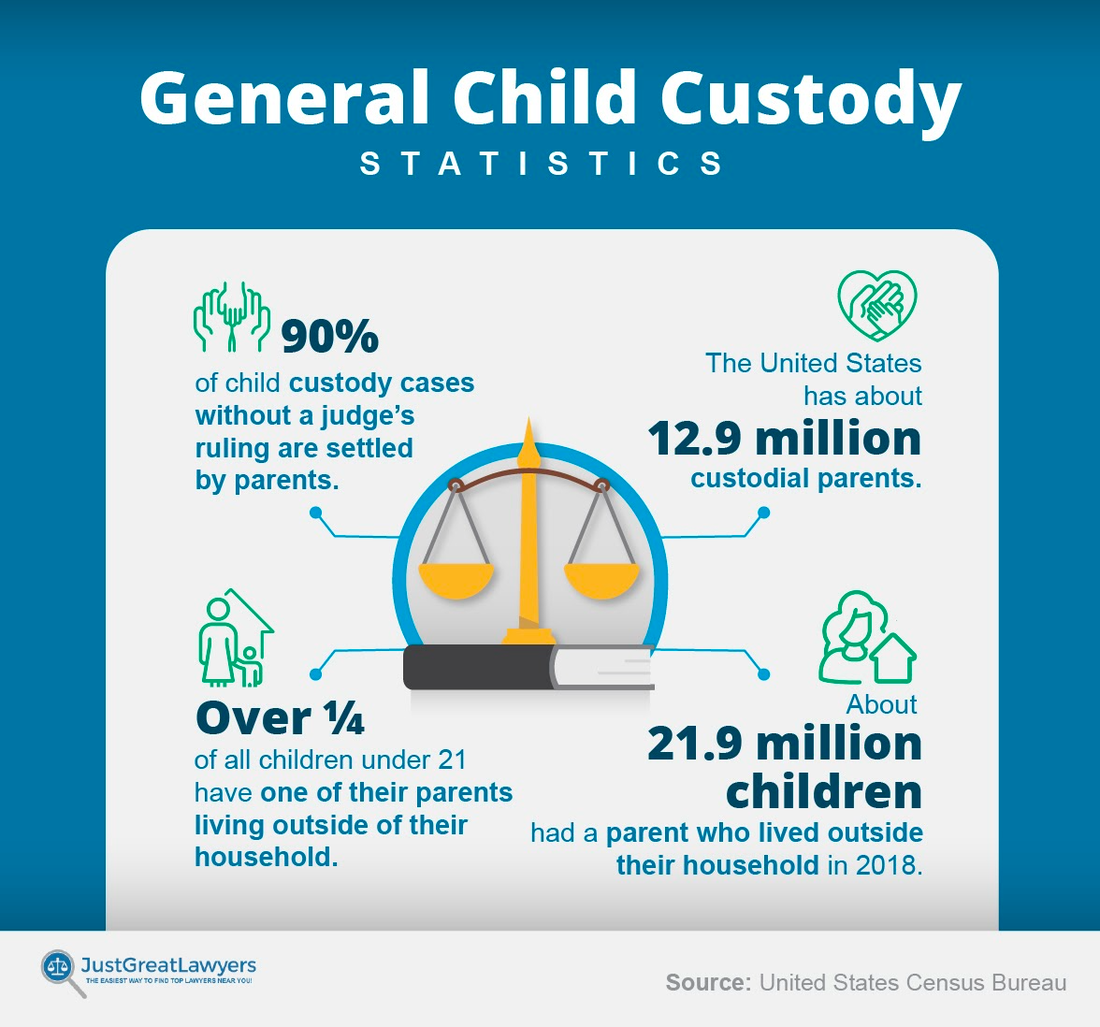
The good news is, parents settle 90% of child custody cases without a judge’s ruling. Here are some other statistics and demographics from the U.S. Census Bureau concerning child custody cases:
The United States has about 12.9 million custodial parents. That’s about 4% of the U.S. population.
Over one-quarter of all children younger than 21 years of age (26.5%) had one of their parents living outside of their household in 2018. That’s approximately 21.9 million children. The percentage was higher for Black children, nearly 49% of whom had a parent living outside the household.
Children in households where one parent was absent were more likely to live in poverty. In fact, about 30.1% of these children were in poverty, about three times the 11.1% rate for children in households with both parents.
Slightly more than half (51.4%) of custodial mothers were employed full-time, year-round in 2017, while 21.6% did not have a job.
Full-time, year-round employment for custodial fathers in 2017 was higher (74.3%), while 9.2% did not work at any point in the year.
Who is most likely to be a custodial parent? Here are a few examples, per the U.S. Census Bureau’s 2020 study:
41.6% of custodial mothers are 40 years old or older. The figure was higher for custodial fathers at 54.6%.
62.9% of custodial fathers are non-Hispanic white men. Custodial fathers were more likely to fall into this category than mothers (see below) and were less likely to be Black.
44.2% of custodial mothers in the U.S. are non-Hispanic white women.
40.4% of custodial mothers were never married.
29.3% of custodial fathers were never married.
As of 2020, approximately 3.3 million fathers have custody of their children.
Legal custody rules differ from one state to another. In fact, states provide most of the guiding legal principles in child custody cases. For instance, some states consider a child’s preference for one custodial parent or another, while others don’t require courts to do so. Still, others allow children’s input once they reach a certain age.
Following are some statistics for child custody in various states per the U.S. Census Bureau’s study:
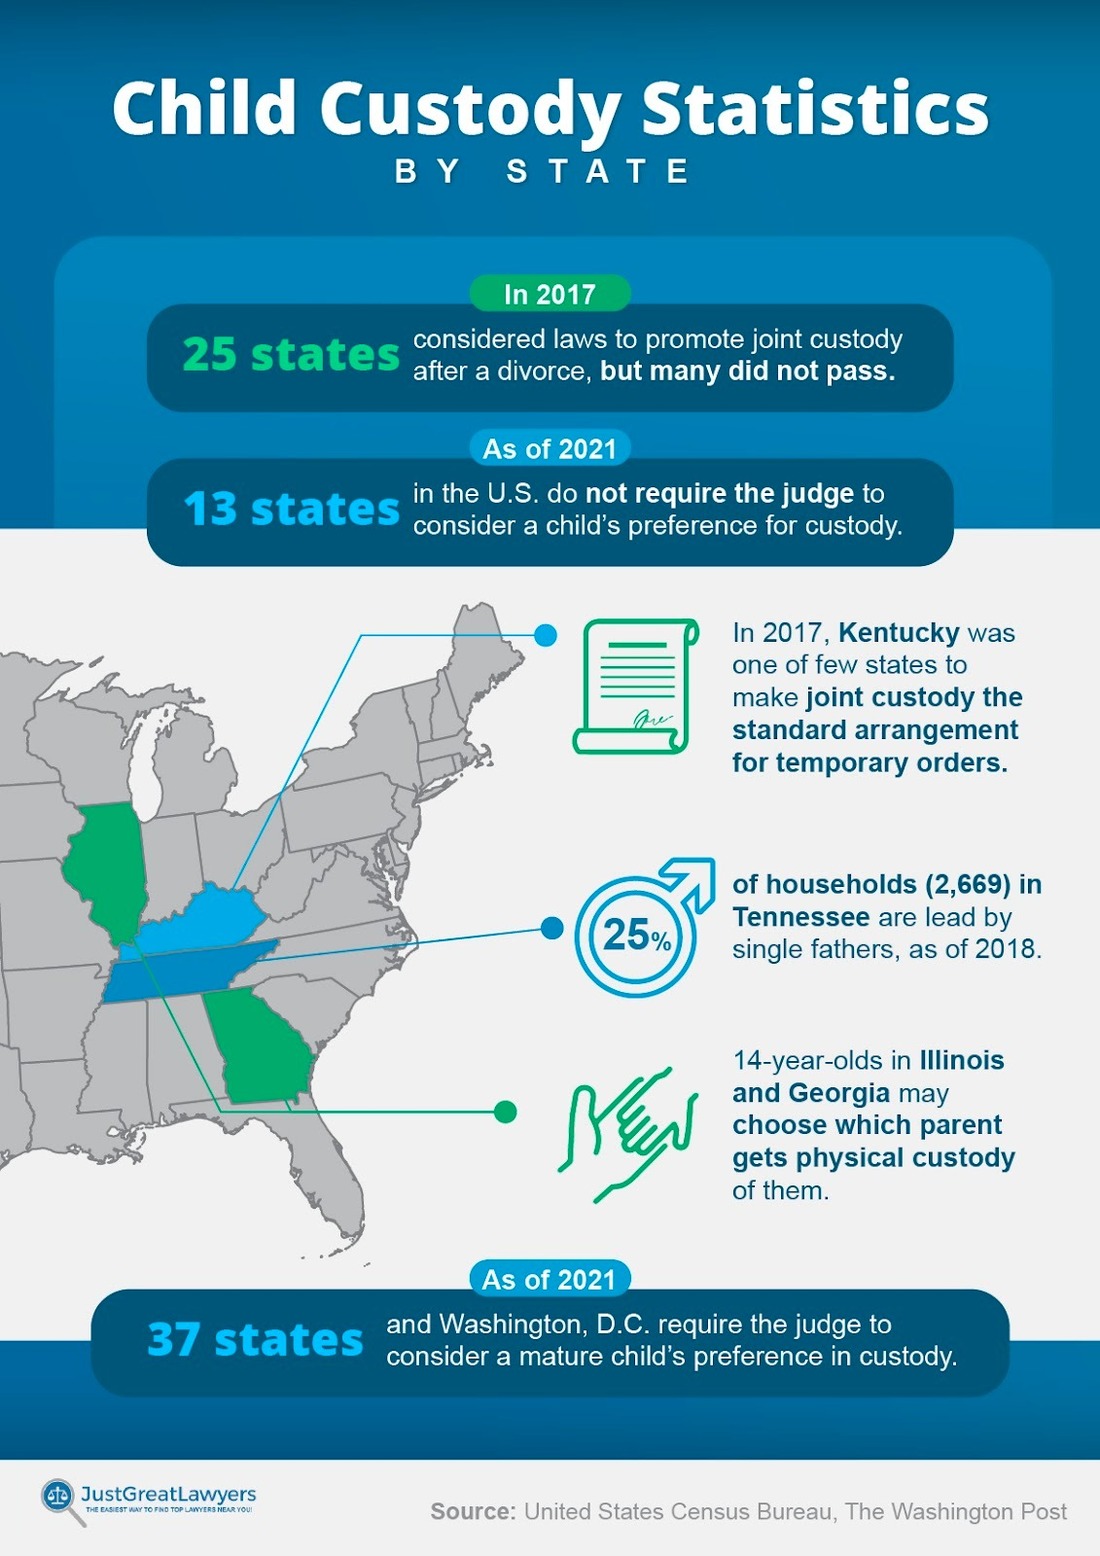
In 2017, 25 states considered laws to promote joint custody after a divorce.
13 states do not require the judge to consider a child’s preference for custody.
37 states and Washington, D.C. require the judge to consider a mature child’s preference in custody.
14-year-olds in Illinois and Georgia may choose which parent gets physical custody of them.
Single fathers run 25% of households (2,669) in Tennessee.
The number of children who live with a custodial parent varies widely according to race, with the highest percentage being among Black children and the lowest percentage among the “other” U.S. Census category that includes several groups.
Approximately half (48.8%) of all Black children had a parent who lived outside their household. This is by far the highest total among any racial group and constitutes nearly twice as many as the total for all children.
Among Hispanic children, 28.7% live with a custodial parent.
Only 22.7% of white children live with a custodial parent.
The percentage is even smaller for children of other races, defined by the U.S. Census in categories such as Asian, Alaska Native, American Indian, Native Hawaiian, and Other Pacific Islander. Among these children, just 13.6% live with a custodial parent.
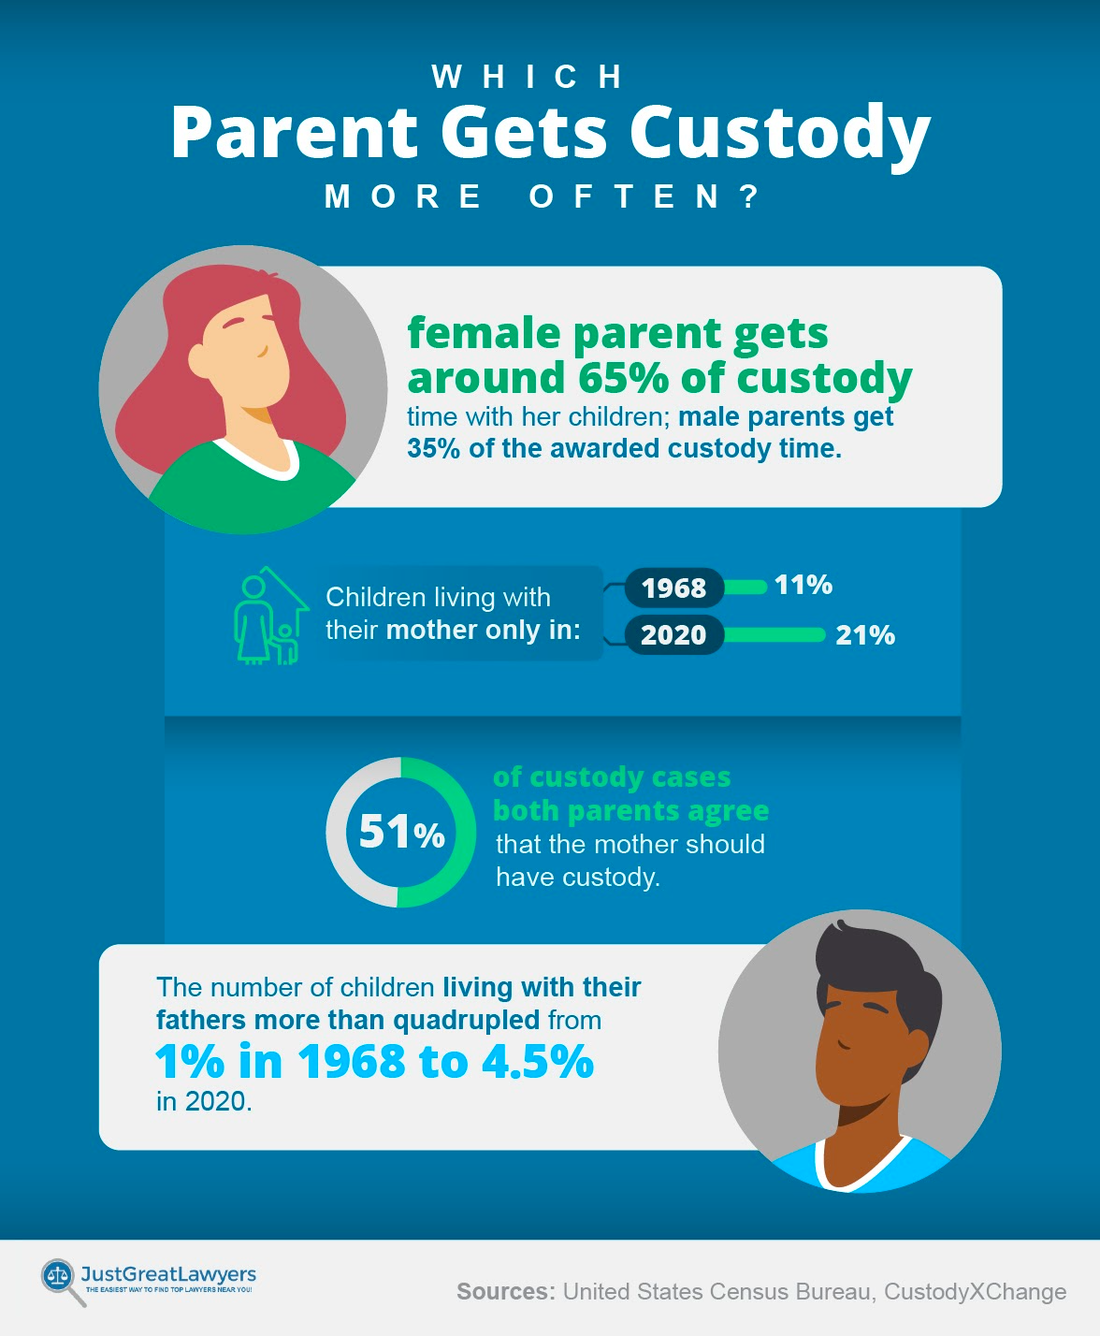
As of 2018, nearly 4 in 5 custodial parents were mothers (79.9%). But the statistics go deeper than that: Not only does the mother get custody of the children more often, the parents agree in more than half the cases (51%) that the mother should have custody.
The number of children living with both their parents has fallen significantly, from 85% in 1968 to 70% in 2020. That has affected both the number of children who live only with their mother and the number who live only with their father.
About 7.6 million (11%) children lived with their mother only in 1968 compared with 15.3 million (21%) in 2020.
The number of children living with their fathers only more than quadrupled from 0.8 million (1%) to 3.3 million (4.5%) between 1968 and 2020.
On the national average, a female parent is granted around 65% of custody time, whereas a male parent receives around 35%. However, in recent years, more fathers have become custodial parents, with the percentage increasing from 16% in 1994 to 20.1% in 2018.
While parents often agree that the mother should receive primary custody of a child, the percentage is not as high as the percentage of mothers who do get custody. This indicates that many divorced fathers who would prefer to have custody of their children are not actually awarded custody.
Does this indicate gender bias?
According to a study by the American Psychological Association, gender stereotypes may indeed play a role in child custody decisions.
In this study, good mothers received greater custody allocations than good fathers did in the United States, Brazil, and Argentina.
Follow-up studies linked maternal primary custody to the propensity to ascribe “warmth-related traits” such as generosity, trustworthiness, and friendliness to mothers. There is also a tendency to believe that mothers have more time to spend with their children. This is, however, less often the case with the rise of two-income families.
In 1960, just one-quarter of married couples were in dual-income households, while the father alone was employed in 70% of families and the mother alone was employed in just 2%.
By 2010, those figures had changed substantially, with 60% of families being dual-income households, the father alone working in just 31% of the cases, and the mother alone working in 6% of the cases.
Who gets custody is one way of measuring custody arrangements. Another is how much time each parent gets to spend with their children. Again, this figure differs from state to state.
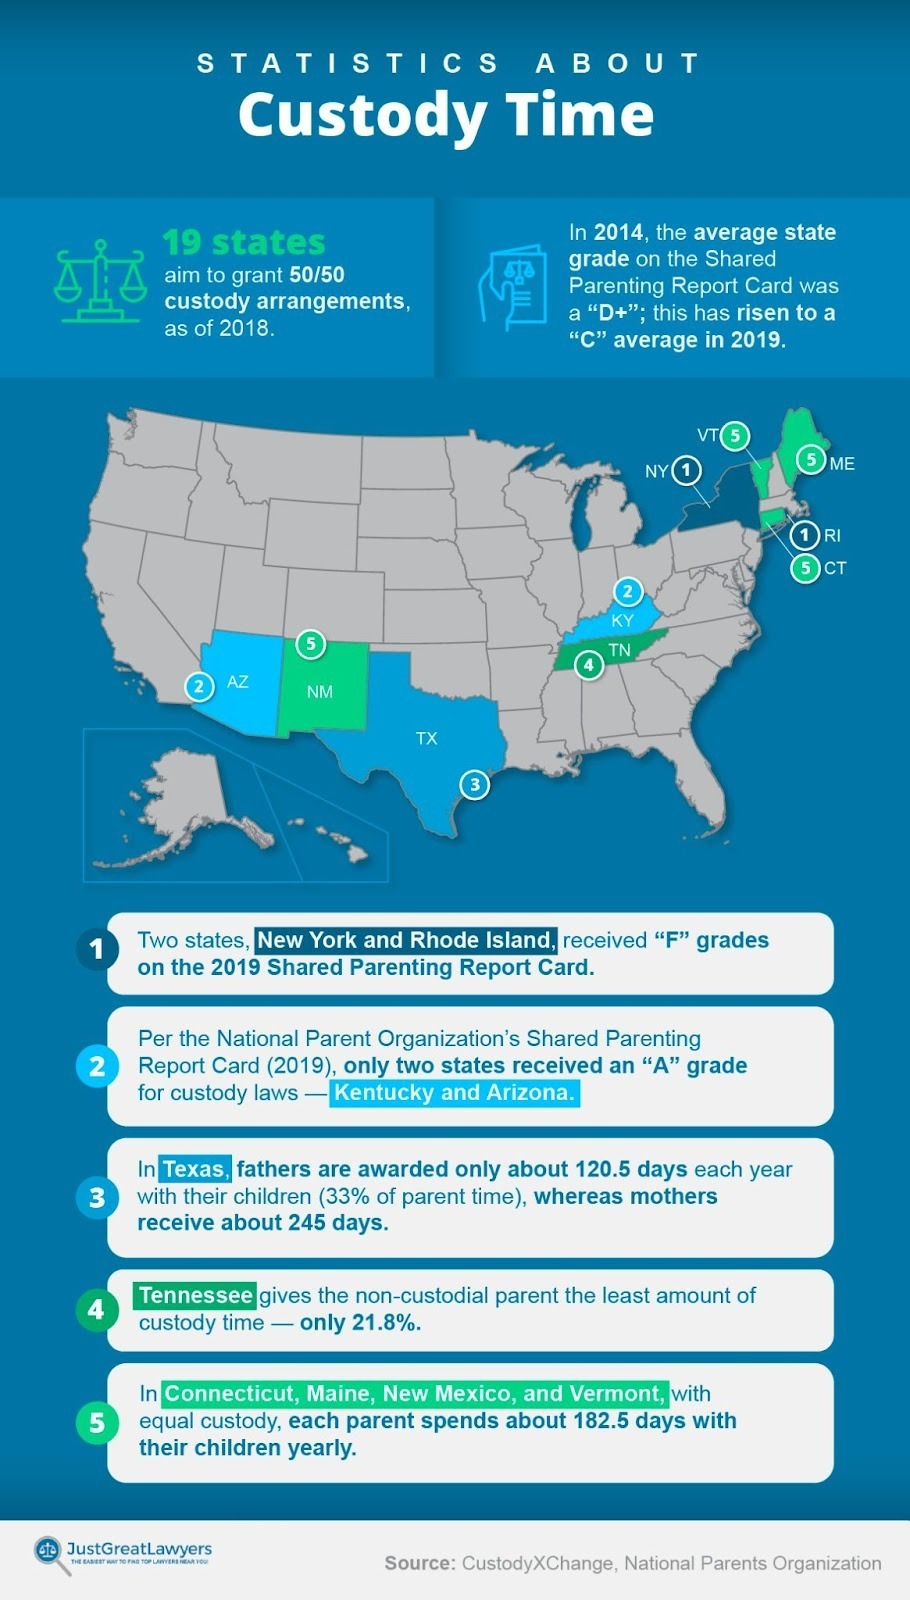
How much custody time a father gets varies widely by state, with 20 states giving fathers 50% of the overall time.
By contrast, fathers in Tennessee get just 21.8% of custody time, while those in Mississippi get 23% of the time, those in Georgia 23.5% of the time, and those in Washington 23.8%.
In Connecticut, Maine, New Mexico, and Vermont, with parenting time divided equally among male and female parents, each parent spends about 182.5 days each year with their children.
In Texas, with just 33% of parenting time allotted to male parents, fathers are awarded only about 120.5 days each year with their children, whereas mothers receive about 245 days.
The terms “shared custody” and “joint custody” are often used interchangeably, but they have slightly different meanings. Joint custody refers to an arrangement under which both parents have an equal say in decisions made regarding a child. Shared custody, by contrast, refers to the amount of time a parent spends with the child.
Shared custody arrangements often strive to create a 50/50 split (equal parenting time) between the parents. This could involve children alternating between parents every month, every six months, or every year. Another possibility is that, after a divorce, children spend weekends with one parent and weekdays and school breaks/summer vacations with the other.
As of 2015, joint-custody arrangements were more common than sole paternal custody but less common than sole maternal custody. Among couples with joint custody, 57% shared both physical and legal custody, an increase from 42% in 1992, with 34% sharing just physical custody and 9% sharing only legal custody.
With regard to joint-custody arrangements:
Occurrences of domestic violence on the part of husbands were reduced by about 2.7 percentage points.
Children in states with joint-custody laws are 1.4 percentage points more likely to drop out of high school.
Children in joint custody states are 1 percentage point less likely to graduate from college.
Suicide rates among men and women declined in states with joint-custody laws, with male suicide rates dropping by about 9% in the long term.
In sole-custody families, the noncustodial parent obviously does not get to spend much time with the child, beyond visitation. Shared custody arrangements, on the other hand, can be challenging, because time needs to be spent taking children back and forth between parents. Unless parents are on the same page (and even if they are), going back and forth between two different environments can be jarring for a child.
The Access and Visitation Grant Program provides funding of $10 million annually to 54 states and territories through the Department of Health and Human Services to increase noncustodial parents’ time with their children.
Under this program, parenting time for noncustodial fathers increased by 62% and for noncustodial mothers by 47% in 2013.
In 2018, states reported that nearly half of the 19,000 noncustodial parents served by the program had increased parenting time.
If you are paying child support, how much you’re likely to pay depends on a variety of factors — most importantly, your gross monthly income: salary, wages, bonuses, capital gains, and interest. Several states have child support calculators online that can help you estimate child-support payments.
Here are some statistics on child support from the U.S. Census Bureau:
Nearly half of all custodial parents (49.4%) had either legal or informal child support agreements in 2017.
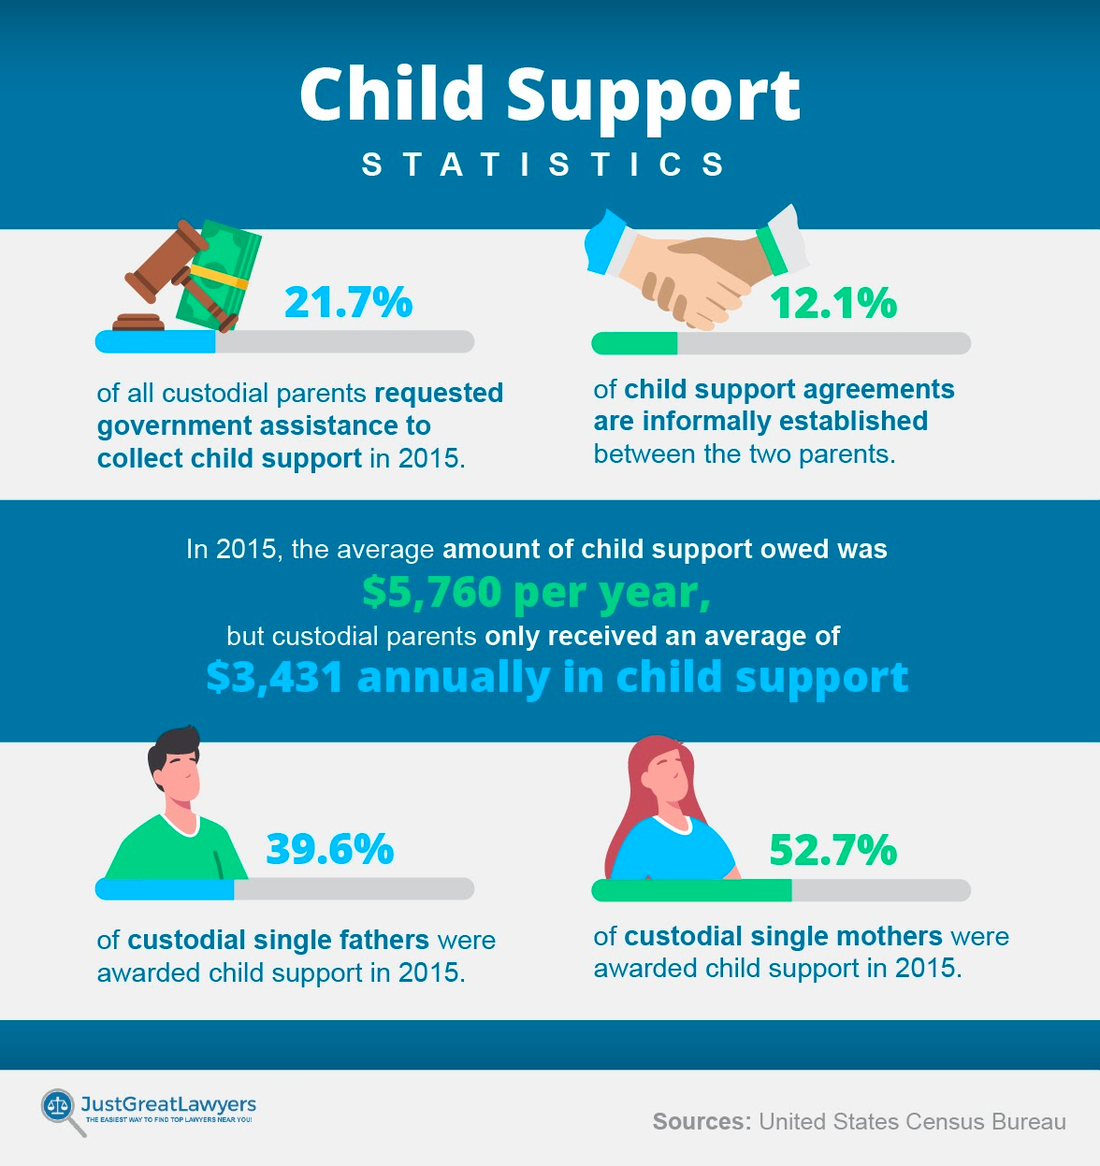
Custodial parents received an average of $3,431 annually in child support in 2017.
In 2015, 12.1% of child support agreements were informally established between the two parents. The remainder (87.9%) were the result of formal legal orders.
Fewer than one-quarter (21.7%) of all custodial parents requested government assistance in collecting child support.
In 2015, the average amount of child support due was $5,760 per year.
39.6% of custodial single dads were awarded child support in 2015.
52.7% of custodial single moms were awarded child support in 2015.
The divorce process is a difficult one, and if you are facing that prospect, it’s a good idea to find a lawyer.
If you have a child custody hearing coming up, it’s also a good idea to speak with a child custody lawyer or family law attorney. Since the law varies from state to state, it would be prudent to familiarize yourself with the law in your state. Child custody forms and calculators are available online.
You’ll also need to gather reference letters and fill out and file the appropriate forms.
It isn’t an easy process, but with the proper tools and guidance, it’s possible to navigate it successfully.